plot_array_layout#
Plot array elements (array layout).
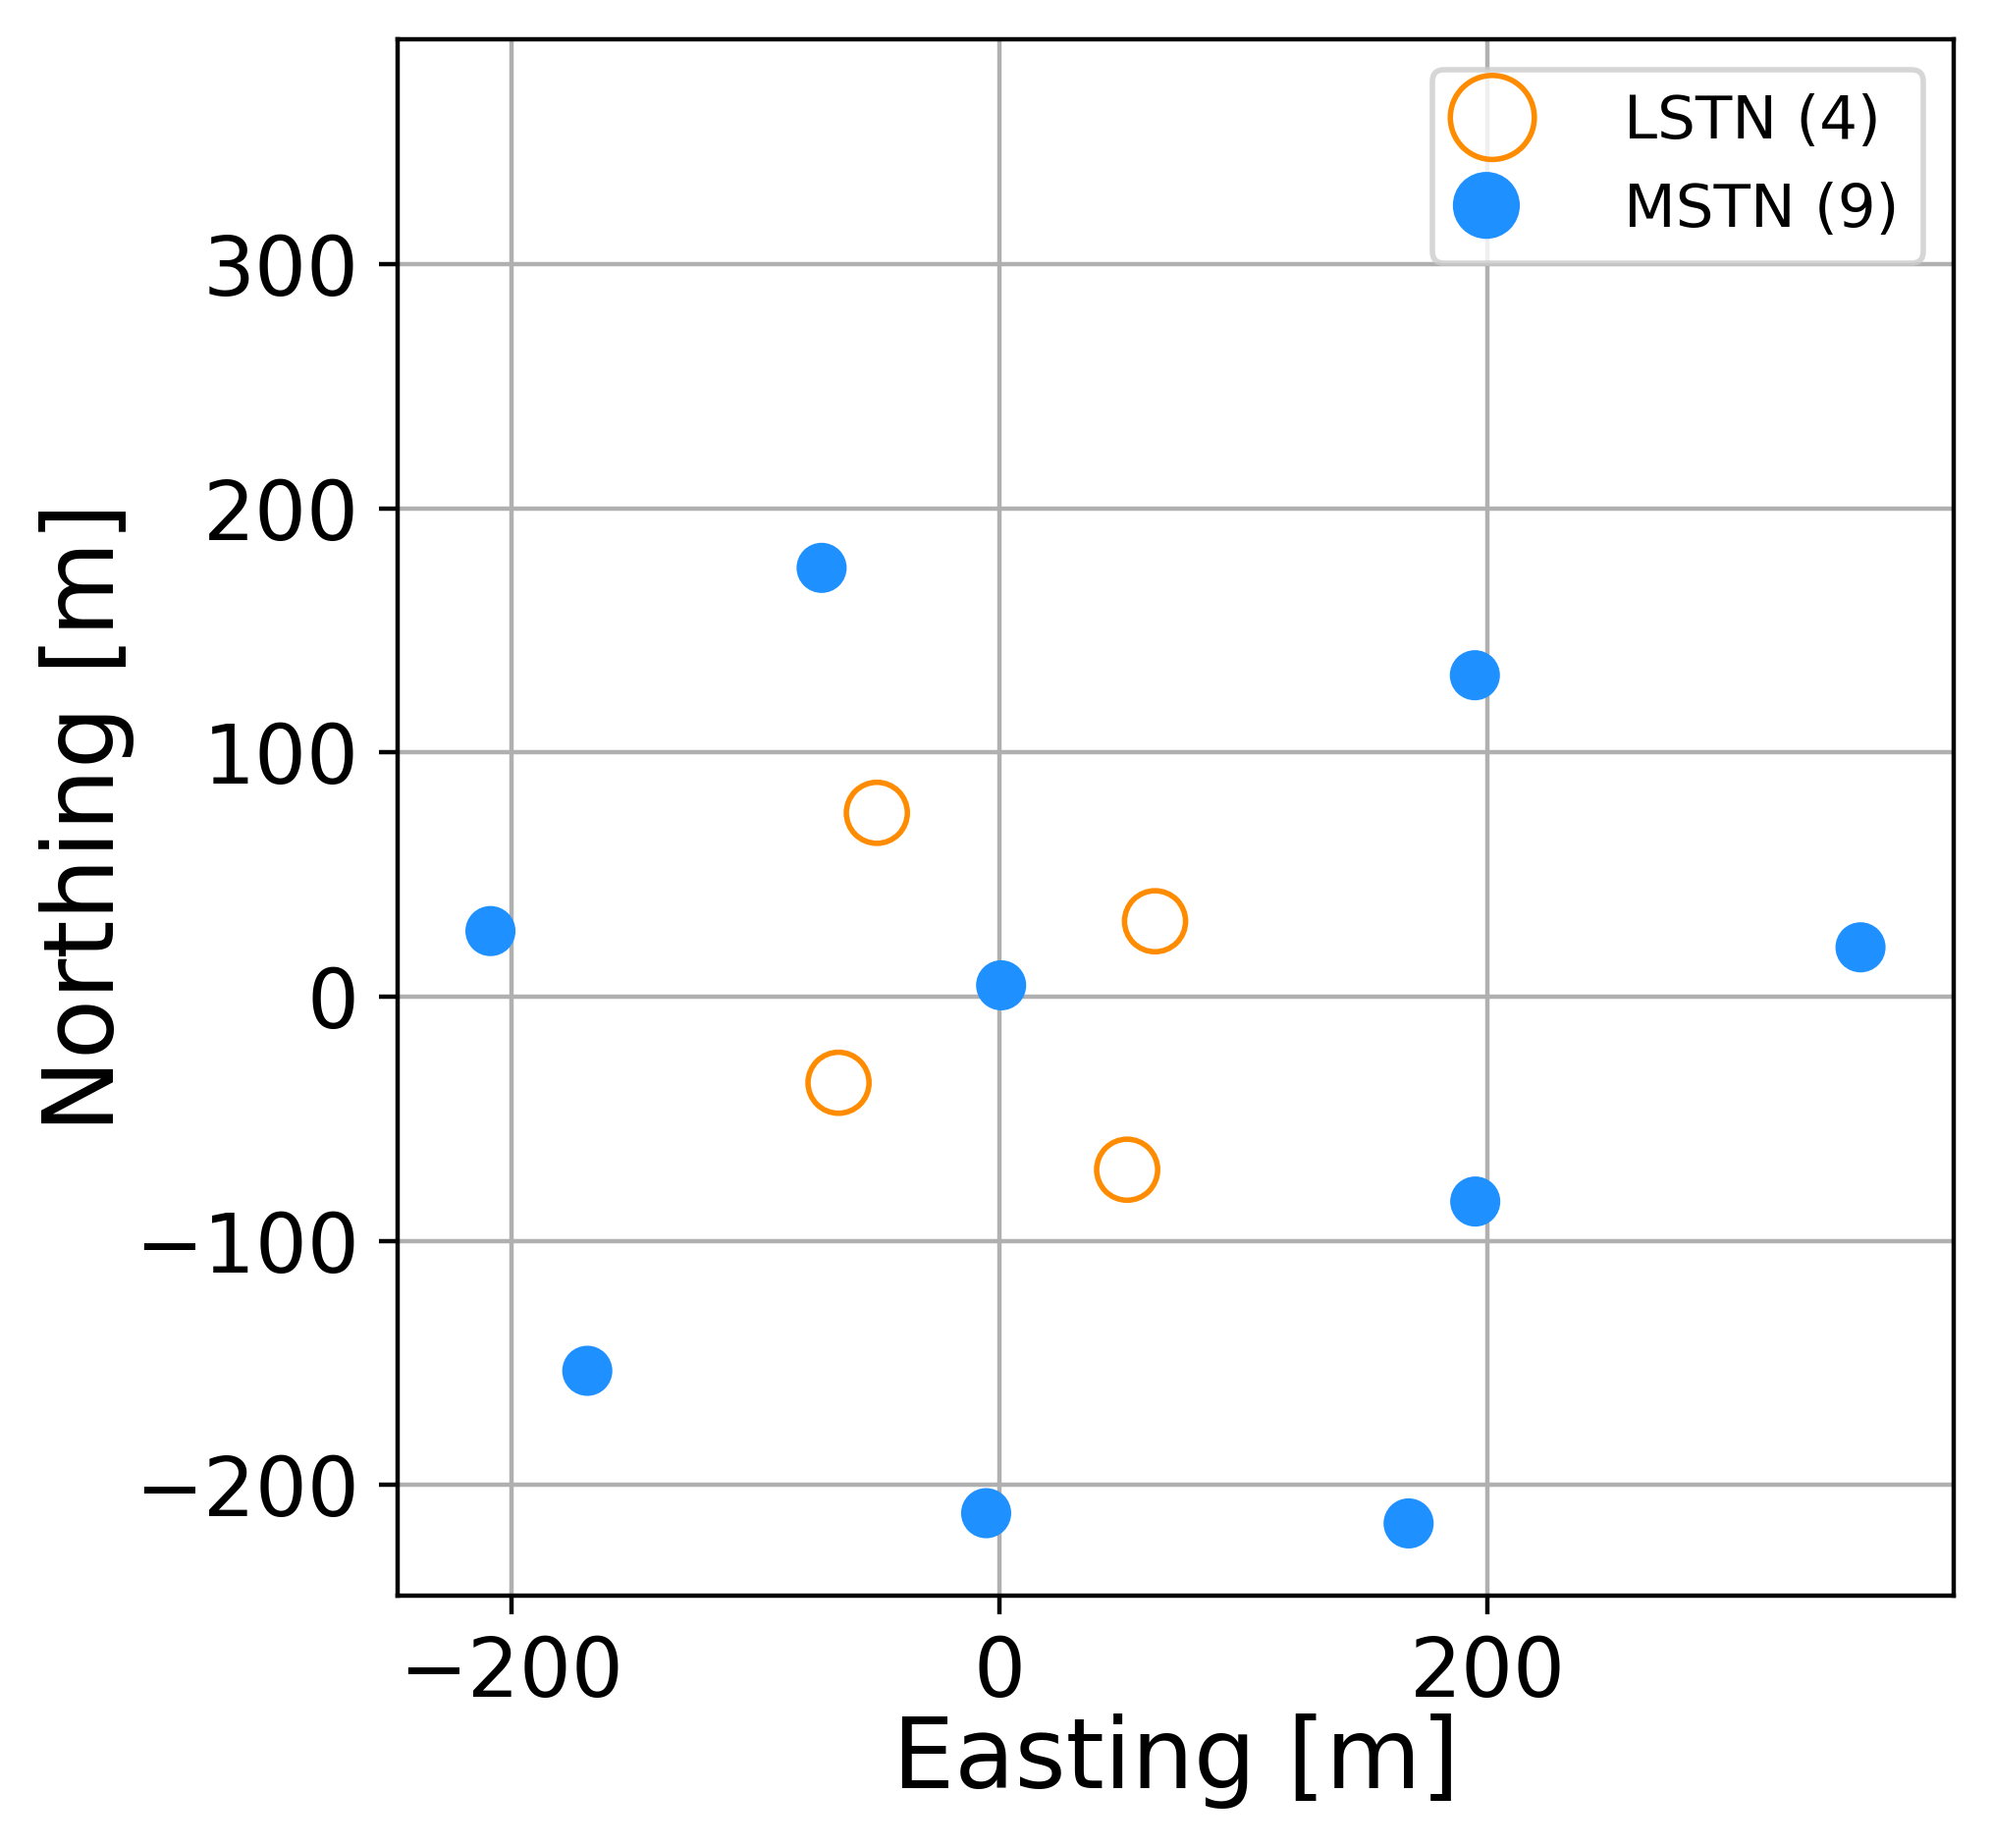
Plot an array layout and save it to file (e.g., pdf). Layouts are defined in the database, or given as command line arguments (explicit listing or telescope list file). A list of input files is also accepted. Layouts can be plotted in ground or UTM coordinate systems.
Listing of array elements follows this logic:
explicit listing: e.g.,
-array_element_list MSTN-01, MSTN05listing of types: e.g,
-array_element_list MSTNplots all telescopes of type MSTN.
A rotation angle in degrees allows to rotate the array before plotting.
The typical image formats (e.g., pdf, png, jpg) are allowed for the output figures.
If no figure_name is given as output, layouts are plotted in pdf and png format.
Example of a layout plot:

Command line arguments#
- figure_namestr
File name for the output figure.
- array_layout_filestr
File (astropy table compatible) with a list of array elements.
- array_layout_namestr
Name of the layout array (e.g., test_layout, alpha, 4mst, etc.).
- array_element_listlist
List of array elements (e.g., telescopes) to plot (e.g.,
LSTN-01 LSTN-02 MSTN).- coordinate_systemstr, optional
Coordinate system for the array layout (ground or utm).
- rotate_anglefloat, optional
Angle to rotate the array before plotting (in degrees).
- show_labelsbool, optional
Shows the telescope labels in the plot.
- axes_rangefloat, optional
Range of the both axes in meters.
- marker_scalingfloat, optional.
Scaling factor for plotting of array elements, optional.
Examples#
Plot layout with the name “test_layout”:
simtools-plot-layout-array --figure_name northern_array_alpha
                           --array_layout_name test_layout
Plot layout with 2 LSTs and all northern MSTs in UTM coordinates:
simtools-plot-layout-array --array_element_list LSTN-01 LSTN-02 MSTN
                           --coordinate_system utm
Plot layout from a file with the list of telescopes:
simtools-plot-layout-array --array_element_list telescope_positions-test_layout.ecsv